By Selen Ozturk
Contributing Writer
SAN FRANCISCO — With low-income communities and communities of color facing growing pollution burdens, California has expanded a tool to identify where people are disproportionately affected and how.
CalEnviroScreen, developed by the California Office of Environmental Health Hazard Assessment, is an interactive pollution tracking map that combines environmental, health and socioeconomic data sets to show which communities experience the greatest cumulative environmental burdens.
The latest update, CalEnviroScreen 5.0, is now available in draft form for public comment before the final version is released later this year.
For over a decade, the map has been used by government agencies, community organizations and researchers to understand where pollution and health risks intersect, explained Dr. Kristina Thayer, director of the Office of Environmental Health Hazard Assessment at a March 3 press conference hosted by the agency and the state Office of Community Partnerships and Strategic Communications.
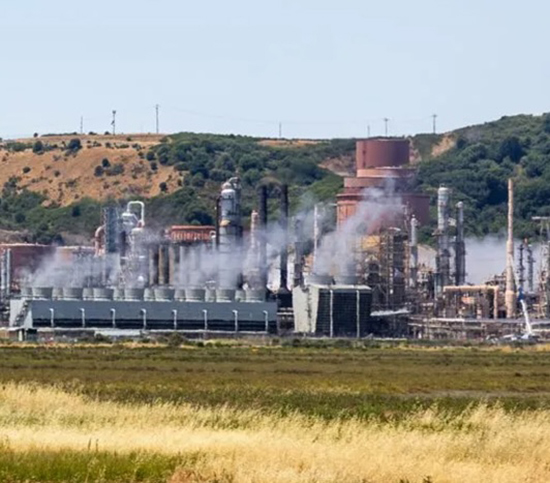
This update adds two new indicators to the tool. One tracks what are known as small air toxic sites — localized and stationary sources of air pollution, including oil wells, gas wells and dry cleaners — that are disproportionately located near communities of color.
The second measure tracks the prevalence of diabetes, which can increase vulnerability to pollution-related health effects including respiratory infections, heart disease, stroke, lung cancer and asthma.
In California, Native Americans have the highest age-adjusted prevalence of diabetes — up to 15% — followed by Pacific Islanders, South Asians, Filipinos and African Americans.
The tool, which is also available in Spanish, has 23 total indicators ranging from environmental factors like pesticides, groundwater pollution, toxic waste, lead risk and air quality to population factors like poverty, unemployment, educational attainment and linguistic isolation.
Other updates include new data on “forever chemicals” for the drinking water quality indicator, measurements of children’s blood lead levels for the housing lead exposure indicator and improvements for scoring hazardous waste facility impacts.
Thayer added that to ensure “the science reflects lived realities,” this version was designed in collaboration with eight community organizations including the California Environmental Justice Alliance, Comité Cívico del Valle, Communities for a Better Environment and Physicians for Social Responsibility Los Angeles.
CalEnviroScreen has also played a major role in directing climate funding; since the program started, the state Environmental Protection Agency has used the map to direct over $9 billion in cleanup funds to communities in disadvantaged regions.
Those regions are represented on the map by census tracts — small, fixed areas defined by the U.S. Census Bureau and typically ranging from 2,000 to 8,000 people. On the pollution map, California has 9,000 tracts which are shaded from red to green depending upon a score which compares their combined indicators to all other areas of the state.
The state’s highest-impacted areas include the Central Valley, South Los Angeles, the Inland Empire, Richmond and southern regions of Oakland and San Francisco, explained Laura August, environmental program manager and scientist at the Office of Environmental Health Hazard Assessment,.
In Richmond, the environmental justice group Communities for a Better Environment used CalEnviroScreen in its Richmond Polluters Pay initiative in August 2024. The initiative forced a historic $550 million settlement from the Chevron Richmond Refinery over 10 years, providing $60–90 million annually for community services, toxic site cleaning and economic transition costs.
“Our members organize in the communities that live near the freeways, refineries, warehouses, oil wells and other pollution sources, and these communities that have historically been left out of the land use decisions,” said Jonathan Pruitt, land use program manager at California Environmental Justice Alliance. “CalEnviroScreen is critical because it does validate what these communities have been experiencing for decades.”
“I’ve been in community meetings and workshops where parents describe children who can’t breathe at night,” explained Martha Dina Argüello, executive director of Physicians for Social Responsibility Los Angeles. “I’ve stood outside schools where diesel buses are idling. I’ve listened [at] community clinics as clinicians, nurses and doctors talk to me about the asthma epidemic, the heart disease and pregnancy complications, they all tell us this story.
“But these are not isolated complaints. These are patterns,” Argüello added. “When there was no CalEnviroScreen, when we were advocating to begin to address this issue of cumulative burden and impacts, people were like, ‘Well, there’s no data.’
“Well, absence of data is not always proof of safety,” she continued. “Permitting decisions were made on one chemical or one facility at a time, and communities were left saying ‘This is not how we live. We live these all together.’”
“For us, it was never about directing resources. It was about changing these systems. It was about bringing data. In public health, we talk about early warning systems. Well, this is an early warning system,” Argüello added. “This is both a tool for communities to understand what’s going on, and for agencies to develop solutions that reduce that cumulative burden.”
Californians can submit their public comments on CalEnviroScreen through April 1.
Selen Ozturk writes for American Community Media.